

TRREB Market
April 2024 home sales were down in comparison to April 2023, when there was a temporary resurgence in market activity. New listings were up strongly year-over-year, which meant there was increased choice for home buyers and little movement in the average selling price compared to last year.
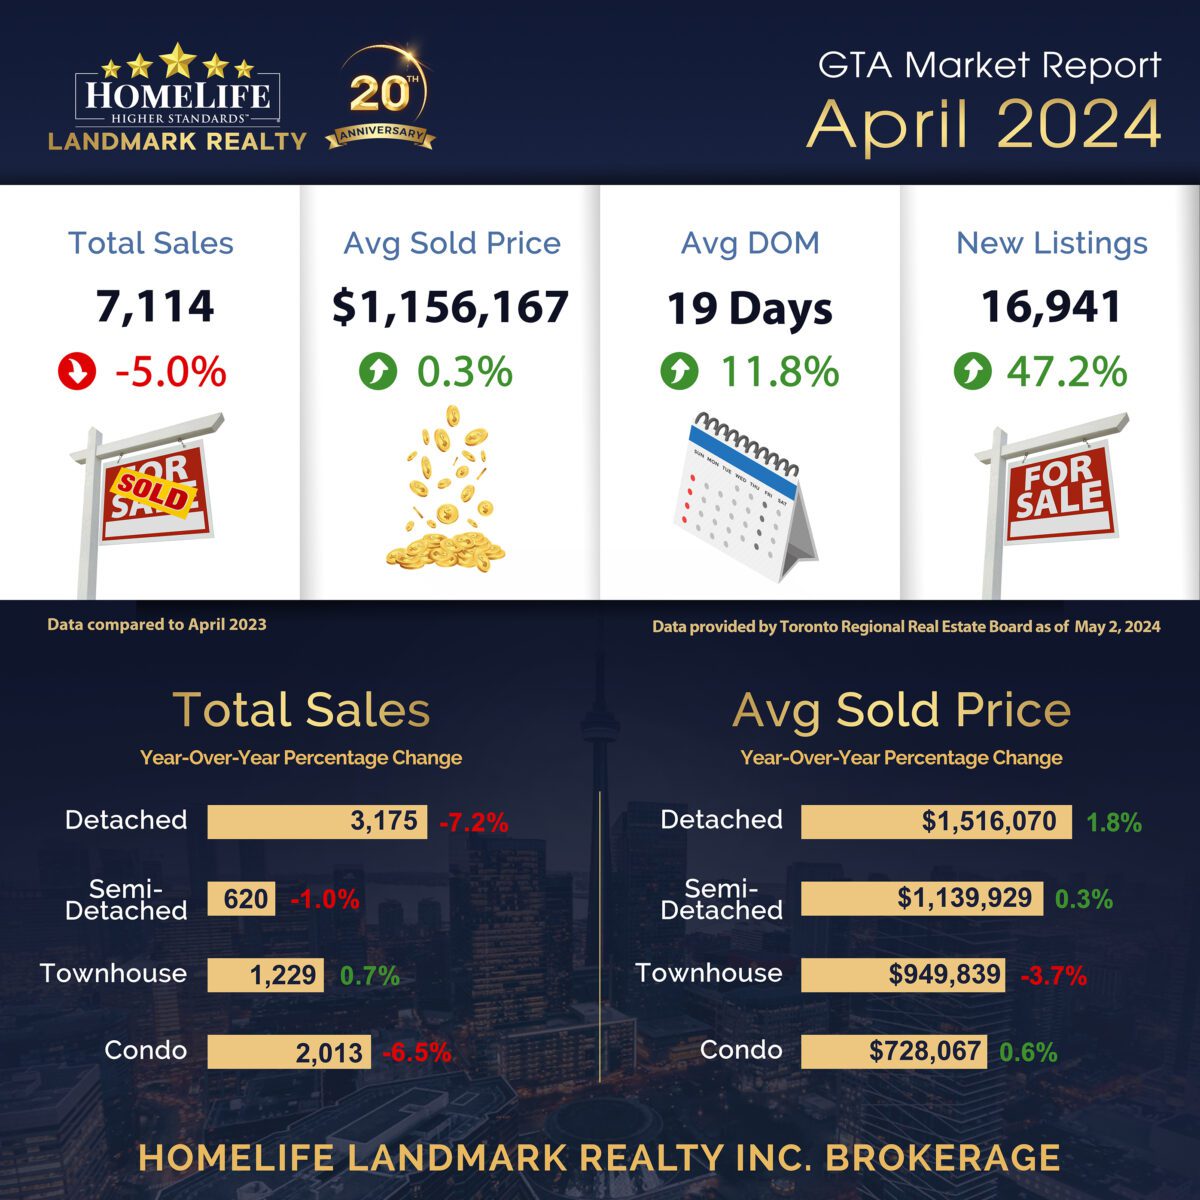
Greater Toronto Area (GTA) REALTORS® reported 7,114 sales through the Toronto Regional Real Estate Board (TRREB) MLS® System in April 2024 – down by 5% compared to April 2023. New listings were up by 47.2% over the same period. On a seasonally adjusted monthly basis, sales edged lower while new listings were up compared to March.
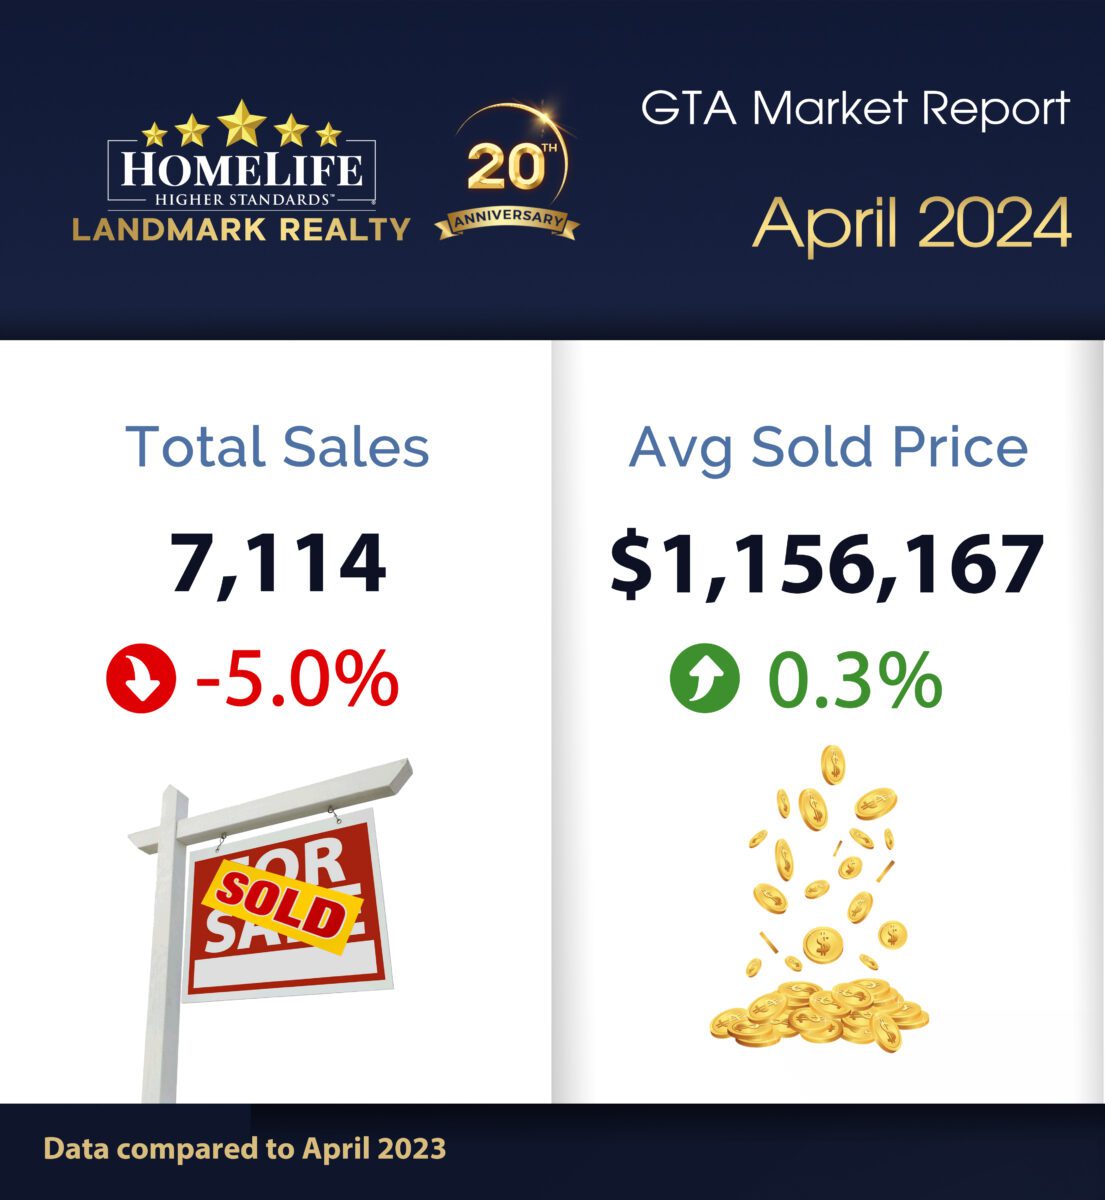
The MLS® Home Price Index (HPI) Composite benchmark was down by less than 1% year-over-year. The average selling price was up by 0.3% to $1,156,167. On a seasonally adjusted month-over-month basis, the MLS® HPI Composite was up by 0.4% and the average selling price was up by 1.5% compared to March.
Market Stats Quick Overview (Data compared to April 2023):
Total Sales: 7,114 ⬇5.0%
Avg Sold Price: $1,156,167 ⬆0.3%
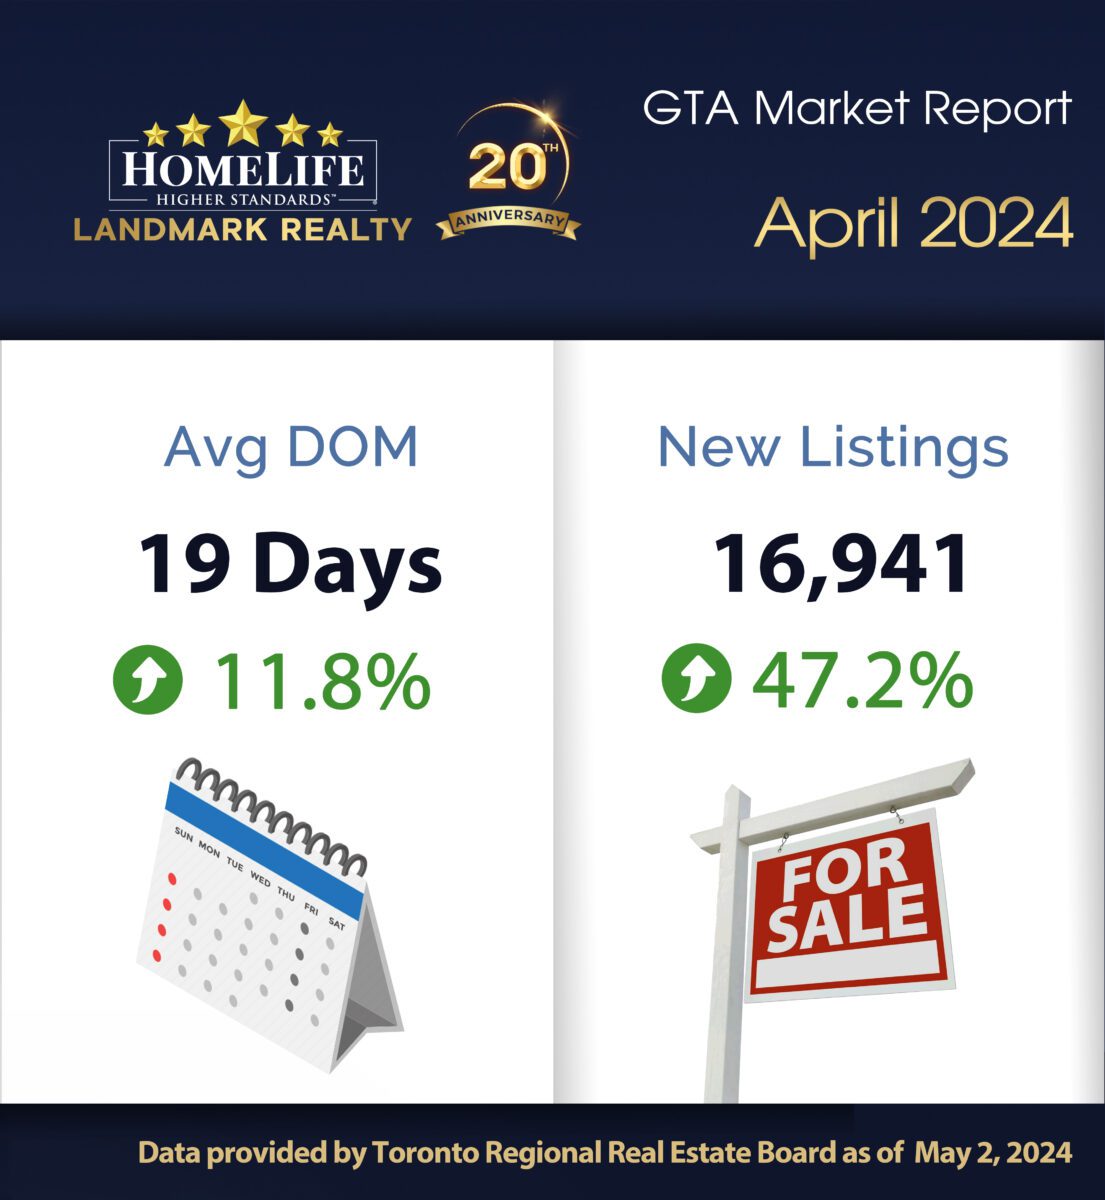
Avg DOM: 19 days ⬆11.8%
New Listing: 16,941 ⬆47.2%
Source: https://trreb.ca
Waterloo Region
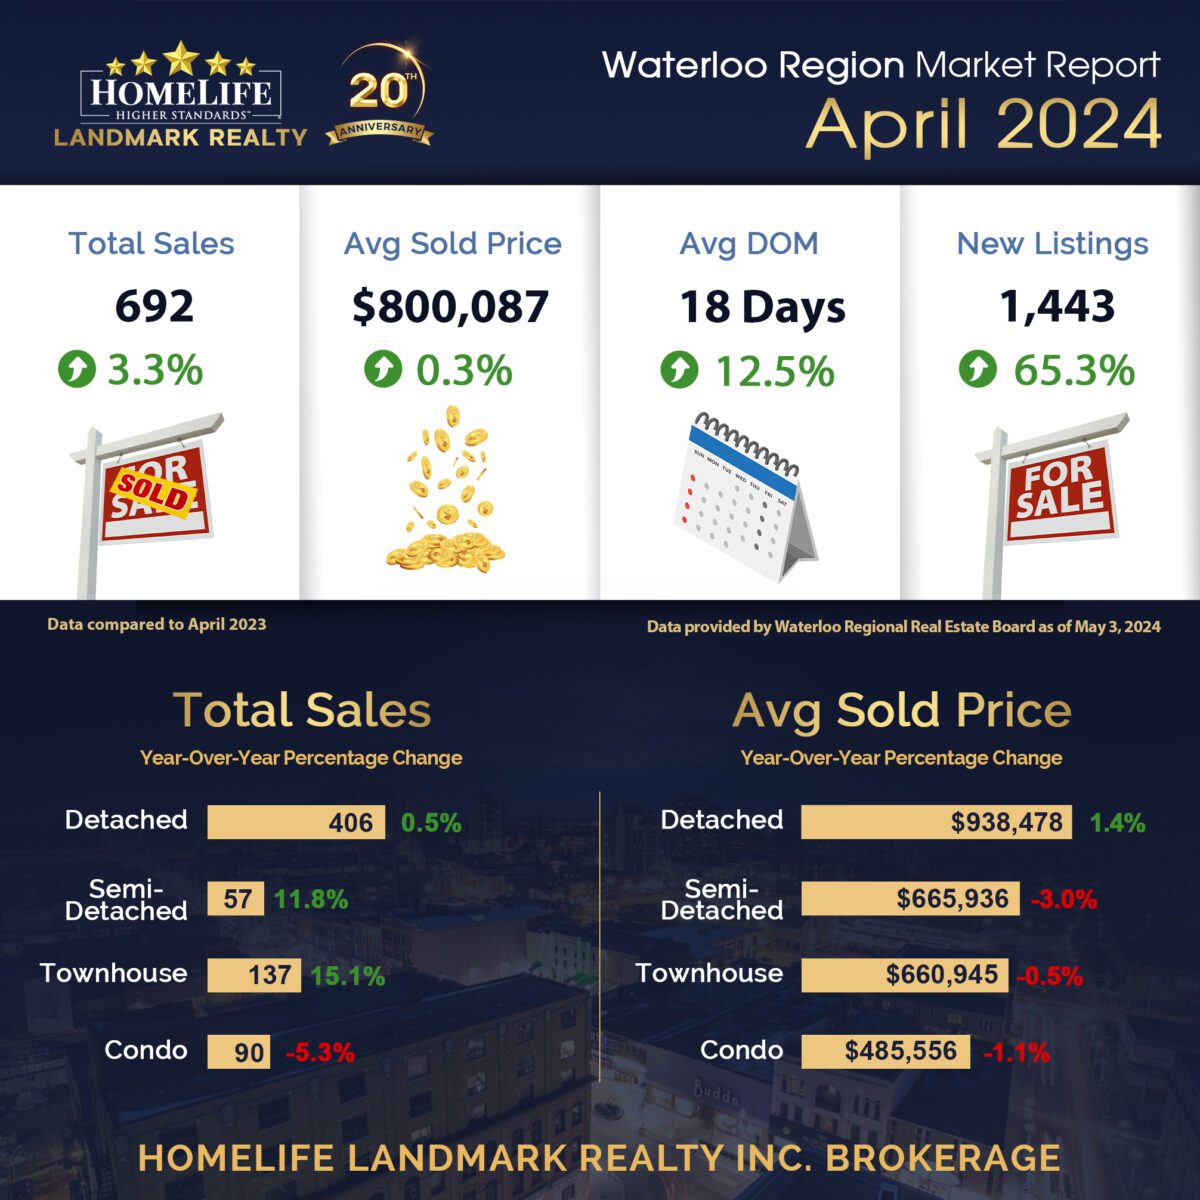
In April, a total of 692 homes were sold via the Multiple Listing Service® (MLS®) System of the Waterloo Region Association of REALTORS® (WRAR). This represents an increase of 3.3% compared to the same period last year and a decline of 12.3% compared to the average number of homes sold in the previous 5 years for the same month.
Total residential sales in April included 406 detached (up 0.5% from April 2023), and 137 townhouses (up 15.1%). Sales also included 90 condominium units (down 5.3%) and 57 semi-detached homes (up 11.8%).
In April, the average sale price for all residential properties in Waterloo Region was $800,087. This represents a 0.3% increase compared to April 2023 and a 0.7% decrease compared to March 2024.
Market Stats Quick Overview (Data compared to April 2023):
Total Sales: 692 ⬆3.3%
Avg Sold Price: $800,087 ⬆0.3%
Avg DOM: 18 days ⬆12.5%
New Listings: 1,443 ⬆65.3%
Source: https://wrar.ca/
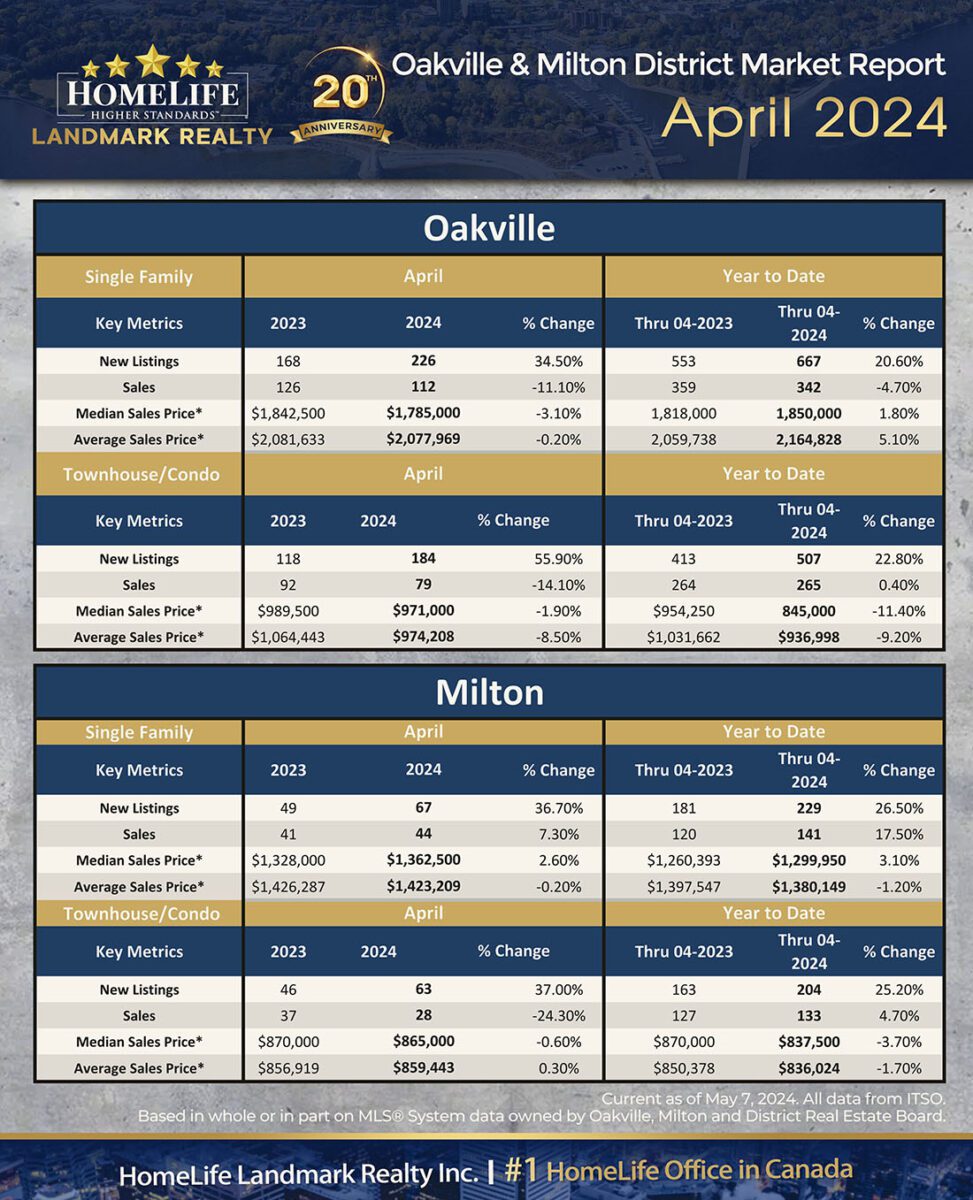
Oakville & Milton District
According to figures released by The Oakville, Milton and District Real Estate Board (OMDREB), the number of all property sales reported by OMDREB REALTORS® decreased 10.8% for Single Family homes and 3.6% for Townhouse/Condo homes compared to April 2023. Median Sales Price increased 3.5% to $1,510,000 for Single Family homes but decreased 6.1% to $795,000 for Townhouse/Condo homes. The total number of new property listings increased 32.9% for Single Family homes and 54.8% for Townhouse/Condo homes compared to this time last year.
For homes processed through the OMDREB MLS® system, the number of Days on Market increased 26.7% for Single Family homes but remained flat for Townhouse/Condo homes this April. Year over year, Inventory increased 70.6% for Single Family homes and 58.8% for Townhouse/Condo homes.
Source: https://www.omdreb.on.ca/
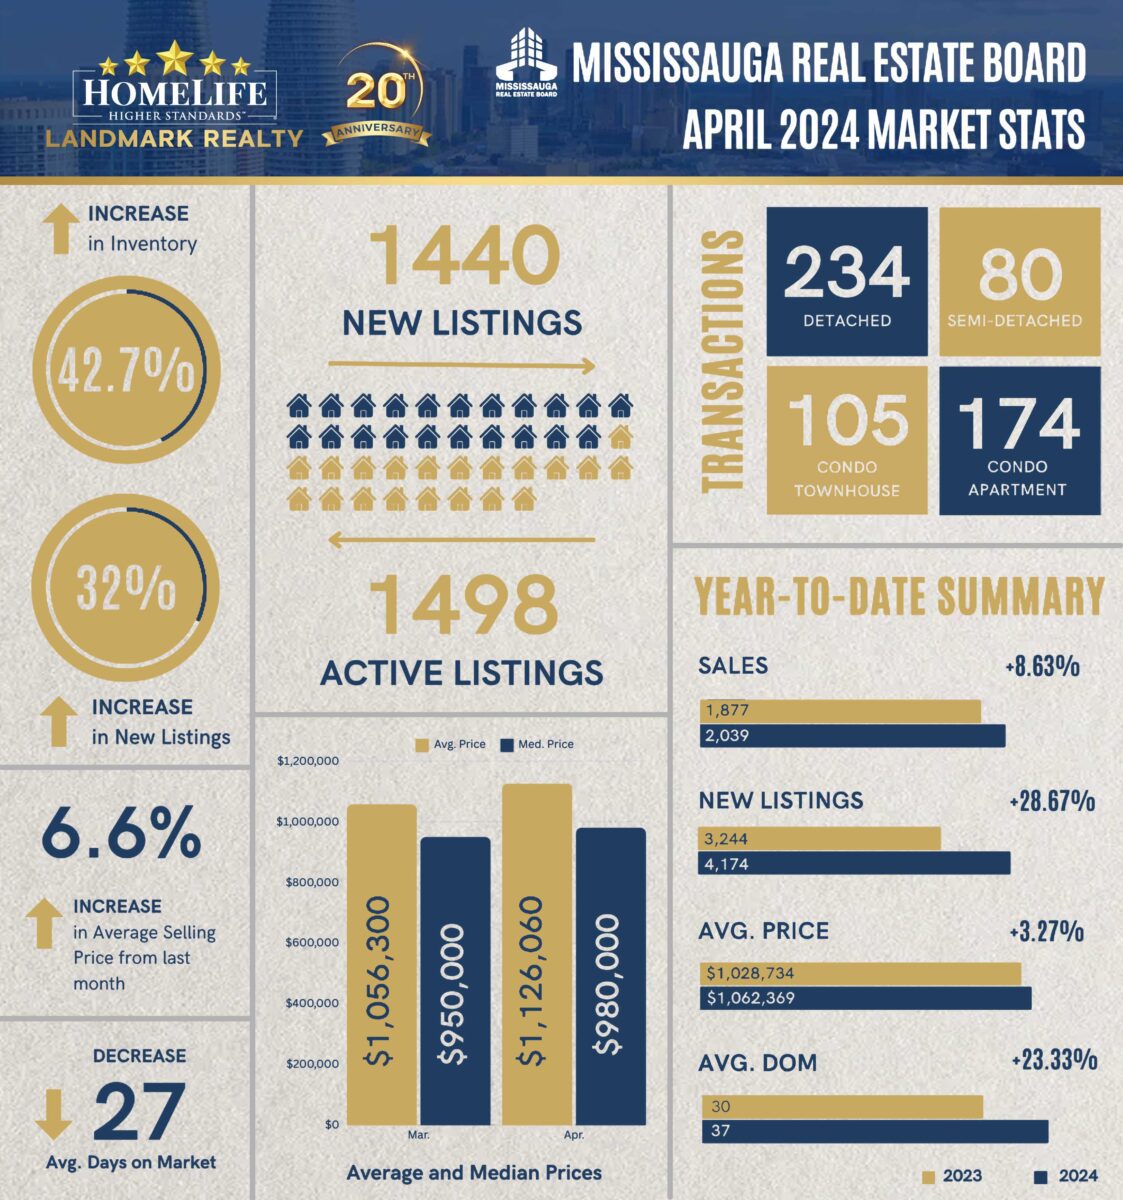
Mississauga Real Estate Board
The number of homes sold through the MLS® System of the Mississauga Real Estate Board totaled 615 units in April 2024. This was a moderate decrease of 4.8% from April 2023.
Home sales were 11.7% below the five-year average and 29.5% below the 10-year average for the month of April. On a year-to-date basis, home sales totaled 2,047 units over the first four months of the year. This increased by 8.9% from the same period in 2023.
The MLS® Home Price Index (HPI) tracks price trends far more accurately than is possible using average or median price measures. The overall MLS® HPI composite benchmark price was $1,097,800 in April 2024, down modestly by 1.7% compared to April 2023.
Market Stats Quick Overview (Year to Date): Total Sales: 2,039 ⬆8.63% Avg Sold Price: $1,062,369 ⬆3.27% Avg DOM: 37 days ⬆23.33% New Listing: 4,174 ⬆28.67%
Source: https://www.mreb.ca/
Contact us to learn more about the GTA housing market:
www.homelifelandmark.com
hello@homelifelandmark.com