

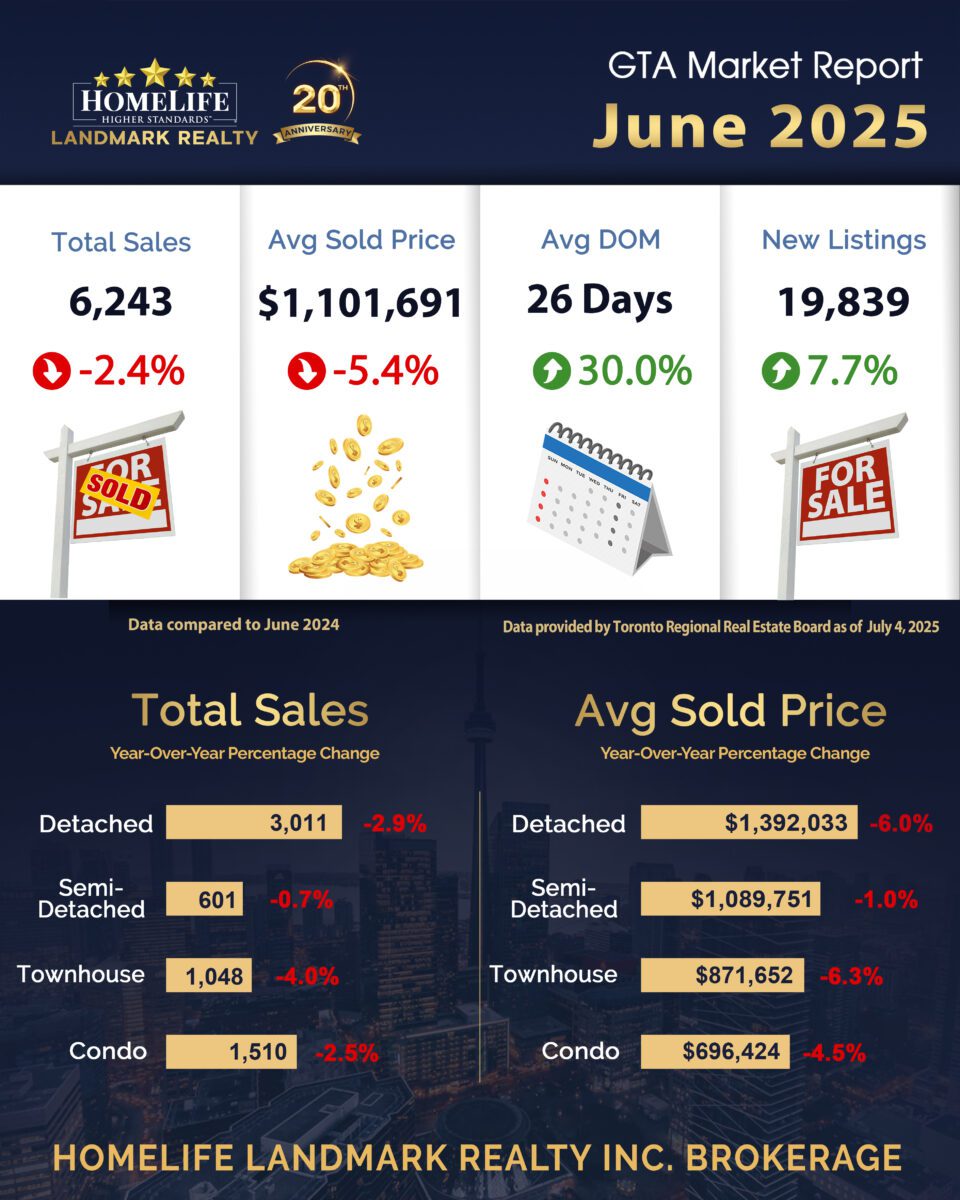
TRREB’s Market Watch Report for June 2025
The Greater Toronto Area (GTA) REALTORS® reported 6,243 home sales through TRREB’s MLS® System in June 2025 – down by 2.4% compared to June 2024. New listings entered into the MLS® System amounted to 19,839 – up by 7.7% year-over-year.
On a seasonally adjusted basis, June home sales increased month-over-month compared to May 2025. New listings declined compared to May. The monthly increase in sales coupled with the monthly decline in new listings continued the tightening trend experienced during the spring.
The MLS® Home Price Index Composite benchmark was down by 5.5% year-over-year in June 2025. The average selling price, at $1,101,691 was down by 5.4% compared to June 2024. On a month-over-month seasonally adjusted basis, the MLS® HPI Composite and average selling price both edged lower compared to May 2025.
Market Stats Quick Overview (Data compared to June 2024):
- Total Sales: 6,243 ⬇2.4%
- Avg Sold Price: $1,101,691 ⬇5.4%
- Avg DOM: 26 days ⬆30%
- New Listing: 19,839 ⬆7.7%
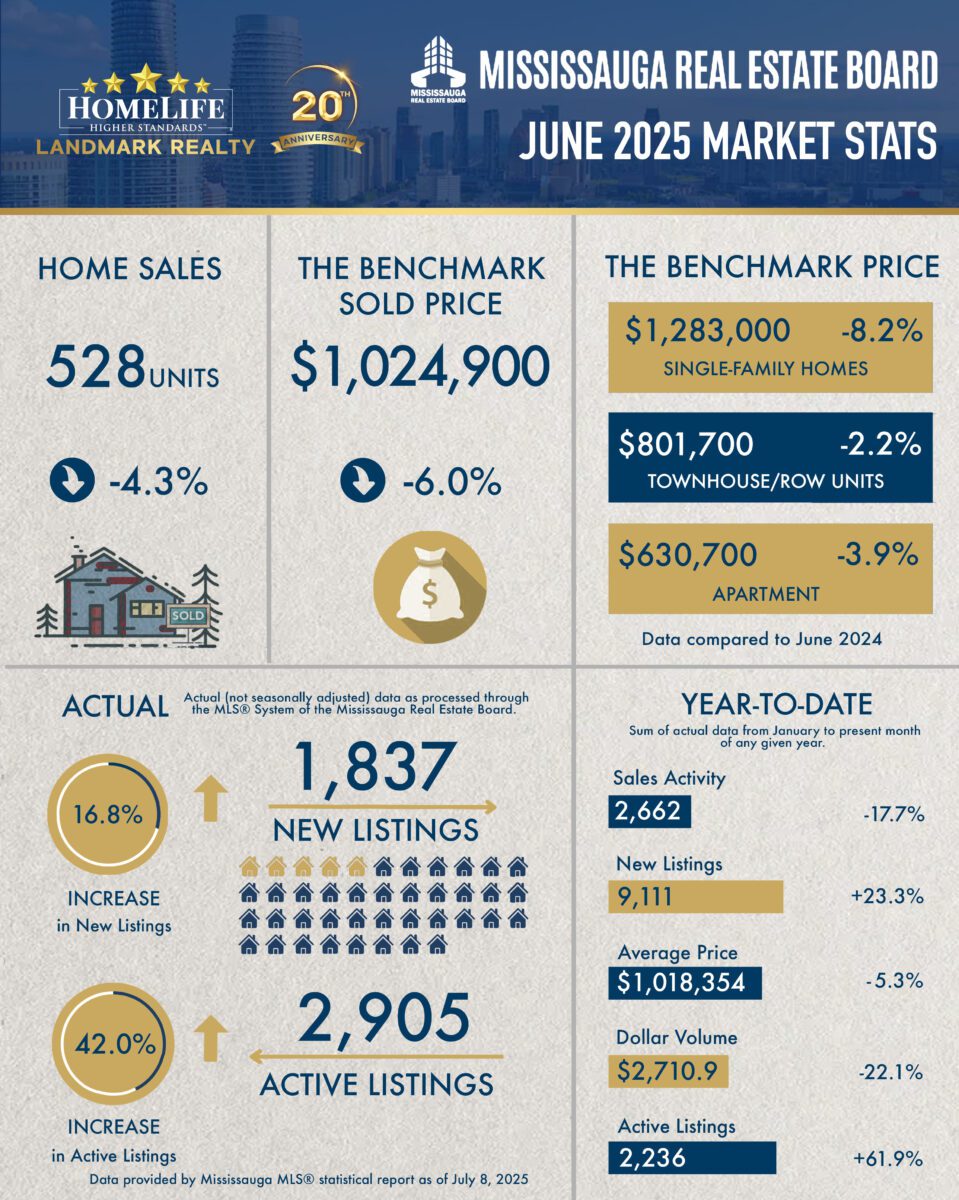
Mississauga Market Watch Report for June 2025
The number of homes sold in Mississauga via the MLS® System of the CornerstoneAssociation of REALTORS® (Cornerstone) totaled 528 units in June 2025. This was down by 4.3% from June 2024.
Home sales were 22.3% below the five-year average and 34.2% below the 10-year average for the month of June. On a year-to-date basis, home sales totaled 2,662 units over the first six months of the year. This was a substantial decrease of 17.7% from the same period in 2024.
The MLS® Home Price Index (HPI) tracks price trends far more accurately than is possible using average or median price measures. The overall MLS® HPI composite benchmark price was $1,024,900 in June 2025, a decline of 6% compared to June 2024.
Market Stats Quick Overview (Comparing to June 2024):
Total Sales: 528 ⬇4.3%
Avg Sold Price: $1,024,900 ⬇6.0%
New Listing: 1,837 ⬆16.8%
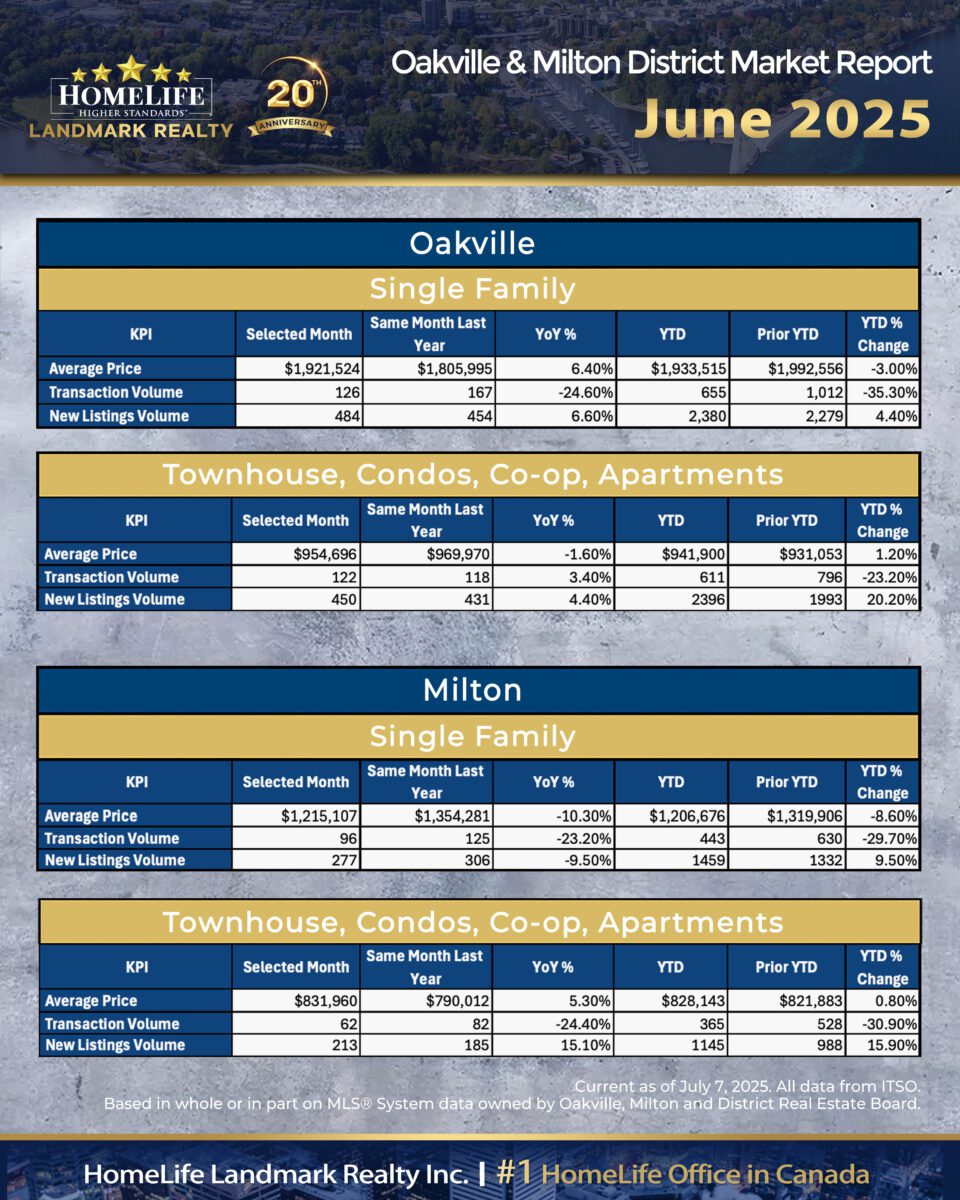
OMDREB Market Stats for June 2025
There are early indicators that Buyers who paused their home buying search due to affordability concerns, tariffs, or trade wars may be re-entering the market in the Halton Region, which is great news for local consumers. Buyers ready to purchase a home will largely benefit from steady interest rates and ample inventory, giving them the benefits of choice and negotiating power.
“The average price of a single family home in Oakville was up 6.4% year-over-year for the month of June. Additionally, the average price of a Milton semi-detached, townhouse, and condo was also up 5.3% year-over-year. Halton Hills saw a significant month-over-month increase in sales volume in both the single family, semi-detached, townhouse, and condo segments. Several other sub-markets across the Halton Region witnessed a month-over-month increase in sales volume pointing towards a late spring market and potentially busier summer,” says OMDREB President Ken Mazurek.
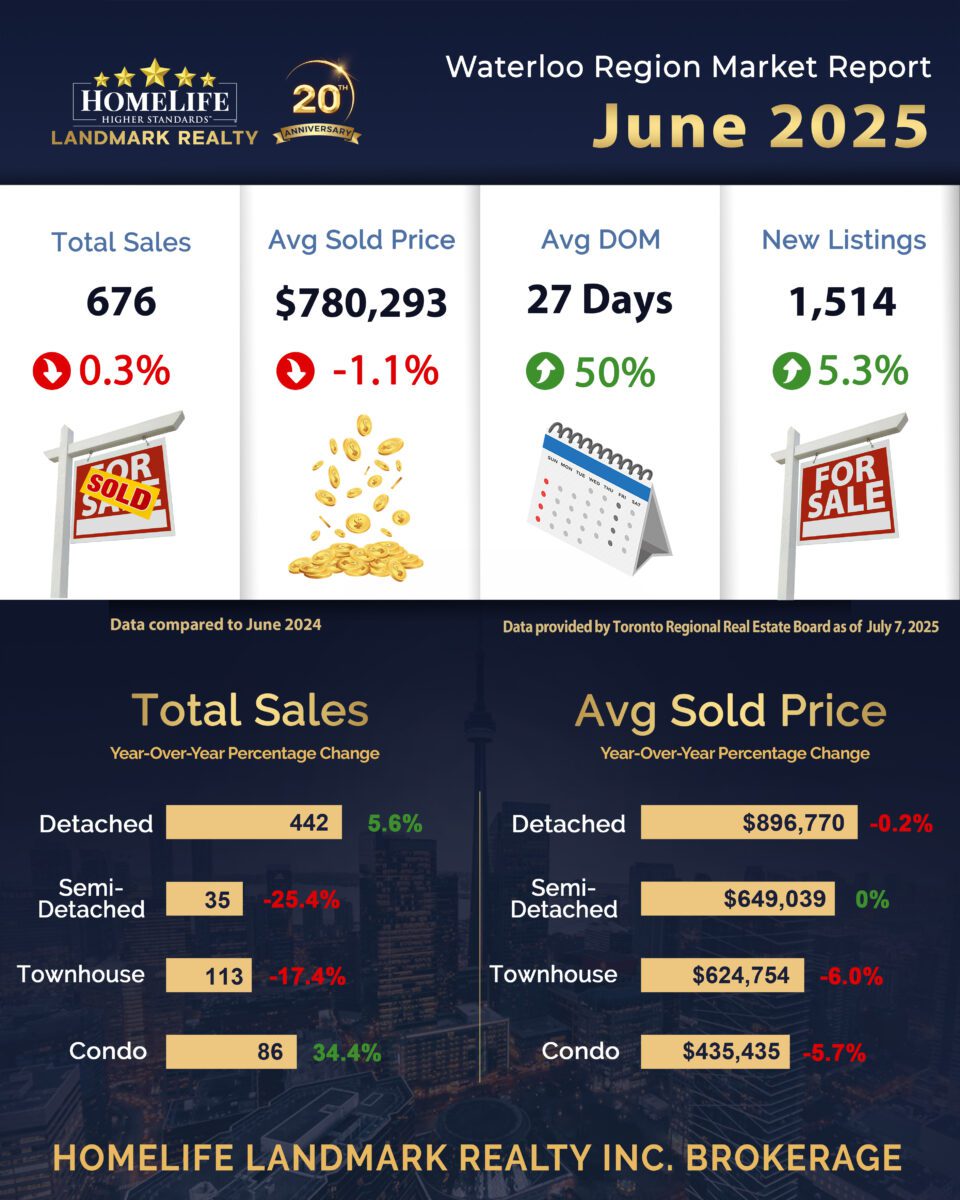
Waterloo Region Market Stats for June 2025
In June, a total of 676 homes were sold in the Waterloo Region via the Multiple Listing Service® (MLS®) System of the Cornerstone Association of REALTORS® (Cornerstone). This represents a 0.3% increase compared to the same period last year and a decline of 21.7% compared to the average number of homes sold in the previous ten years for the same month.
Total residential sales in June included 442 detached homes (up 5.6% from June 2024), and 113 townhouses (down 17.4%). Sales also included 86 condominium units (up 34.4%) and 35 semi-detached homes (down 25.4%).
In June, the average sale price for all residential properties in Waterloo Region was $780,293. This represents a 1.1% decrease compared to June 2024 and a 1.2% decrease compared to May 2025.
🔍 Market Stats Quick Overview (Data compared to June 2024):
📎 Total Sales: 676 ⬇0.3%
📎 Avg Sold Price: $780,293 ⬇1.1%
📎 Avg DOM: 27 days ⬆50%
📎 New Listings: 1,514 ⬆5.3%